What's New


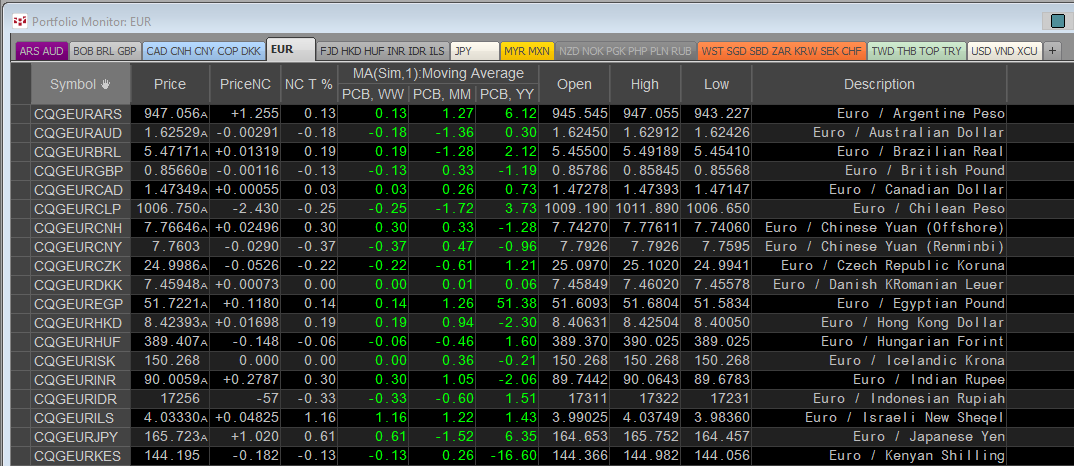
CQG offers institutional pricing data across 430+ currency pairs of market data. Sourced directly from tier-1 banks and non-bank market makers worldwide, the feed provides up to 50 years of historical data across multiple timescales is available. The enablement is CQG Global FX.

more

Excel's SWITCH function is similar to Excel's IF and IFS functions and is the topic of this post. First, a review of the IF and IFS functions.

Users of Microsoft Excel may utilize the IF function to apply a logical test and if true return a result and if false return a different result.… more

This post details how to extract data from a large array, such as a correlation matrix, to make your workflow more efficient.

First, as the LAMBDA function is used, a brief overview is provided.

Excel 365 offers the LAMBDA function, which was detailed here.

The LAMBDA function… more

Dumbbell charts have the name due to the look of the data displayed having the appearance of a dumbbell.

In other words, a circle at each end connected by a line. In the image above the top circle on the right is this week's current percentage net change for cocoa (symbol: CCE), and… more

This post offers solutions to parsing data in Excel using string functions. As an example, this RTD formula returns the long description of a Crude Oil calendar spread:

=RTD("cqg.rtd", ,"ContractData", "CLES12", "LongDescription",, "T")

Which returns:

Crude Light (Globex) Calendar… more

The CME Website has information resources for options traders in the form of downloadable Excel tables with important needed details such as:

Commodity CodeCME Globex CodeProduct NameProduct GroupProduct SubgroupExchangeRulebook ChapterStrike Price Listing RuleExercise StyleContrary… more

The CQG Rank Study ranks the individual chart points of a market over a specified number of previous trading periods. For example, if the current bar's close had a rank of 3, and the periods were ranked from highest to lowest and the user selected a ranking over 25 periods, that would indicate… more

The Klinger Volume Oscillator (KVO) was developed by Stephen Klinger. The study uses the difference between two exponential smoothed moving averages (EMA) of the "Volume Force" and includes a signal line.

This post offers a unique look at the KVO in that most published articles detailing… more

The Kalman Filter is a recursive algorithm invented in the 1960s to track a moving target from noisy measurements of its position and predict its future position. The Kalman filter is an optimal estimation algorithm and is a type of state observer, but it is designed for stochastic systems.

more

A popular form of market analysis is to maintain a real-time table of market performance based on an annualized basis. For example, the QSS 2.0 displayed below has a sorted column highlighted with the yellow font detailing the percent net change so far for the year by the stocks known as the… more